
The Atomization Will Continue Until Morale Improves
Consumer Sentiment, Social Connectedness, and the Post-COVID Happiness Collapse

1. Introduction
Something unusual happened to American happiness after 2020, and it doesn’t fit the standard story. The years following the COVID-19 pandemic brought a remarkably strong economic recovery by most conventional measures. Unemployment returned to historically low levels, wages rose, and growth rebounded sharply. Yet Americans consistently reported feeling worse. Consumer sentiment remained deeply depressed throughout the 2021-2025 period, producing a post-2020 gap from standard macroeconomic predictions roughly five times larger than the historical norm.
This paper argues the sentiment puzzle can’t be solved by better economic measurement alone. Using the General Social Survey (“GSS”), it documents the largest decline in reported happiness in the survey’s fifty-year history. More strikingly, the decline was concentrated among the wrong groups. Bachelor’s degree holders, top earners, and self-identified upper-class respondents experienced some of the largest drops, while lower-class respondents experienced little measurable decline at all. This inversion, in which economic winners fell hardest and economic losers were relatively spared, is difficult to reconcile with explanations rooted primarily in material hardship.
The evidence instead points toward a deterioration in the social foundations of subjective wellbeing. Respondents with higher levels of social contact experienced substantially smaller declines in happiness, and the broader U.S. population shifted toward lower levels of social interaction after COVID. These patterns are correlational rather than causal, and this paper treats them as such. The stronger claim, and the one most directly supported by the evidence, is that the post-2020 sentiment puzzle isn’t an economic mismeasurement problem, and the cross-group pattern of the happiness collapse is the clearest evidence for that conclusion.
2. Conceptual Framework
2.1 Consumer Sentiment as a Socially Embedded Measure
Consumer sentiment indices are typically treated as measures of economic expectations. Under this view, sentiment reflects how households perceive current and future economic conditions, and a well-specified macroeconomic model should explain most variation in sentiment using variables such as unemployment, inflation, income growth, and output growth.
This paper proposes that consumer sentiment is partly socially embedded and captures not only economic expectations but also broader dimensions of subjective wellbeing. Historically, these dimensions tended to move together. People experiencing improving economic conditions also tended to feel more optimistic about life, more socially connected, and more confident in the broader social environment. The post-2020 period appears to represent a breakdown in that relationship. Macroeconomic conditions recovered while broader measures of wellbeing and social connectedness deteriorated. If sentiment reflects both economic and social conditions, then models based only on macroeconomic fundamentals will produce persistent residuals when those dimensions diverge.
Throughout this paper, “social connectedness” refers specifically to measurable interpersonal interaction and informal social embeddedness, including the frequency with which people spend time with friends, neighbors, and community members. The analysis focuses on this narrower interpersonal dimension rather than broader concepts such as institutional trust or political engagement, which are related but more difficult to measure cleanly in the available data.
2.2 COVID as an Accelerant Rather Than Origin
The deterioration in social connectedness documented in this paper didn’t begin with COVID. A substantial literature, including Putnam’s (2000) work on civic disengagement, Twenge’s (2017) research on generational social change, and the Surgeon General’s recent advisory on loneliness (U.S. Department of Health and Human Services, 2023), documents a long-running decline in American associational life that predates the pandemic by decades. Trust in institutions, participation in civic organizations, frequency of informal socializing, and reported closeness to neighbors had all been gradually weakening since roughly the 1980s. By 2019, the U.S. was already a measurably less socially connected country than it had been a generation earlier.
COVID-19 accelerated and intensified these trends. Lockdowns, social distancing, and the rapid shift toward remote work disrupted many of the routines through which social connection is maintained, including workplaces, religious congregations, community organizations, and casual neighborhood interaction. Some of these patterns recovered after reopening, but many only partially recovered or never recovered at all. The result was a broader shift toward lower levels of everyday interpersonal interaction. This framing matters for interpreting the paper’s findings. The post-2020 happiness decline occurred against a backdrop of already weakening social connectedness rather than a historically high baseline of community life. It also suggests that the sentiment gap may prove persistent. If part of the decline reflects a structural weakening of social connection rather than a temporary economic shock, then improving macroeconomic conditions alone may not fully restore consumer sentiment to its historical relationship with fundamentals.
2.3 Candidate Non-Material Mechanisms
The finding documented in Section 3 that higher-income, highly educated, and otherwise advantaged Americans experienced the steepest post-COVID happiness declines is difficult to reconcile with material explanations but consistent with several non-material mechanisms.
The first and most directly testable mechanism is declining social connectedness. Remote work, which was concentrated among college-educated knowledge workers (Dingel & Neiman, 2020), eliminated a major source of daily in-person interaction, while many of the civic, professional, and community institutions through which higher-status Americans maintain social ties were heavily disrupted during the pandemic (Jones & Cox, 2023; AmeriCorps & U.S. Census Bureau, 2024). If higher-status groups rely more heavily on these forms of social infrastructure, then a broad disruption to social life could plausibly produce larger declines in wellbeing among those groups. The GSS provides direct measures of socializing frequency that allow this mechanism to be examined empirically in later sections.
Other non-material mechanisms are also plausible. Higher-status individuals may have experienced larger declines because disruption imposed greater psychological costs on those accustomed to stability and control. Increased screen time and exposure to online information environments may also have amplified pessimism, particularly among remote workers whose social interaction shifted heavily toward digital spaces. More broadly, the post-COVID period may have produced a generalized erosion in perceived social stability and institutional confidence that affected higher-status individuals especially strongly.
The paper focuses primarily on the social connectedness channel because it is the mechanism most directly measurable in the available data. However, the broader conclusion doesn’t depend on identifying any single mechanism conclusively. The stronger claim supported by the evidence is that the post-COVID happiness collapse is difficult to explain using conventional material frameworks alone.
3. Data and Patterns
3.1 The Happiness Collapse and Its Inverted Status Gradient
The General Social Survey has tracked self-reported happiness in the United States since 1972, asking respondents whether they’re “very happy,” “pretty happy,” or “not too happy.” Over the five decades of the survey’s history, the share reporting “very happy” fluctuated within a relatively narrow band, oscillating between roughly 29% and 36% across business cycles, administrations, and periods of social change, with no sustained trend in either direction. That stability ended after 2020.
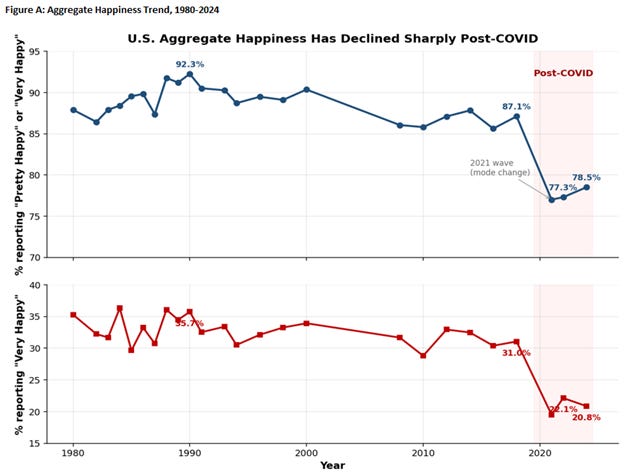
Figure A shows the full time series. The share of Americans reporting they’re “very happy” stood at 31.0% in the final pre-COVID survey conducted in 2018 and this share had averaged 30.7% across the 2016-2018 period. By 2022, it had fallen to 20.8%, marking a decline with no precedent in the survey’s history. The combined “pretty happy” or “very happy” share, which had been comparably stable, fell from 87.1% pre-COVID to 77.3% in 2021 and 78.5% in 2022-2024. Following standard GSS methodology, the 2021 wave is excluded from the primary analysis due to the mode change that year from in-person to telephone and web administration, which is documented to have independently depressed reported happiness. Regardless, the post-COVID decline is substantial and statistically robust across the 2022 and 2024 waves.
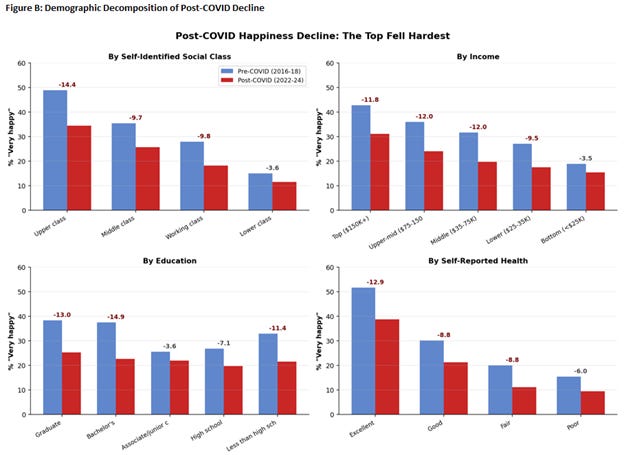
Clearly the aggregate decline is large, but what makes it analytically useful is its distribution across groups. Figure B presents the pre-versus-post comparison across four independent status measures: self-identified social class, household income, educational attainment, and self-reported health. The pattern is consistent and striking. Among self-identified upper-class respondents, the share reporting “very happy” fell 14.4 percentage points, middle-class respondents fell 9.7 points, working-class respondents 9.8 points, and lower-class respondents fell 3.6 points. Of note, the lower-class respondents had 95% confidence interval spanning zero (-7.9, +0.8), indicating the lower-class happiness decline is statistically indistinguishable from no change at all.
The income gradient tells a similar story. Top earners (household income above $150,000) fell 11.8 percentage points, upper-middle earners ($75,000-$150,000) fell 12.0 points, and the bottom income group (below $25,000) fell 3.5 points. This time, the bottom income group had a confidence interval that barely excludes zero (-6.7, -0.2). The education gradient is among the most precisely estimated: bachelor’s degree holders fell 14.9 percentage points (-18.9, -10.9) and graduate degree holders fell 13.0 points (-18.3, -7.6), while those with associate degrees fell just 3.6 points and high school graduates fell 7.1 points. The health gradient is consistent with the others: respondents in excellent health fell 12.9 points, while those in poor health fell 6.0 points.
These confidence intervals matter. Almost all of the high-status declines are estimated with precision that comfortably clears zero. The upper-class interval is wide, reflecting the small cell size, but it excludes zero. By contrast, the lower-class decline doesn’t, which makes the lower end of the status distribution the only group for which the data are consistent with no happiness change at all. This asymmetry indicates that the post-COVID happiness collapse is a phenomenon of the upper and middle of the status distribution, not of its bottom. The gradient is robust across all four status measures, which are conceptually and empirically distinct. The fact that all four produce the same inversion significantly reduces the likelihood that the pattern is a product of any particular measure. The consistency across all four measures increases confidence that the pattern is real.
Further, the inverted gradient isn’t an artifact of the immediate post-pandemic disruption. Among the two methodologically comparable post-COVID surveys in 2022 and 2024 which were both conducted using standard in-person administration, high-status groups showed little or no recovery. Several actually deteriorated further with graduate degree holders’ gap from baseline widening from -10.3 to -15.7 percentage points between 2022 and 2024, and top earners’ from -9.6 to -13.7. Low-status groups moved modestly in the other direction: lower-class respondents’ gap from baseline narrowed from -5.7 points in 2022 to -1.3 points in 2024, and bottom-income respondents improved slightly as well. The upper-class versus lower-class differential is nearly identical in 2024 (-13.2 points) to its immediate post-pandemic level (-13.3 points in 2021). Therefore, whatever is driving the inversion wasn’t resolved by economic normalization, and the divergence between high-status and low-status trajectories since 2022 has if anything reinforced it.
This cross-group pattern is the paper’s central empirical anchor, and it constrains the space of plausible explanations immediately. Any mechanism rooted in material hardship, whether inflation eroding purchasing power, housing affordability squeezing budgets, or labor market insecurity creating anxiety, predicts the opposite gradient: lower-income and lower-status groups should fall hardest, because they have fewer buffers against economic stress. The data show the opposite effect.
3.2 The Sentiment-Fundamentals Gap
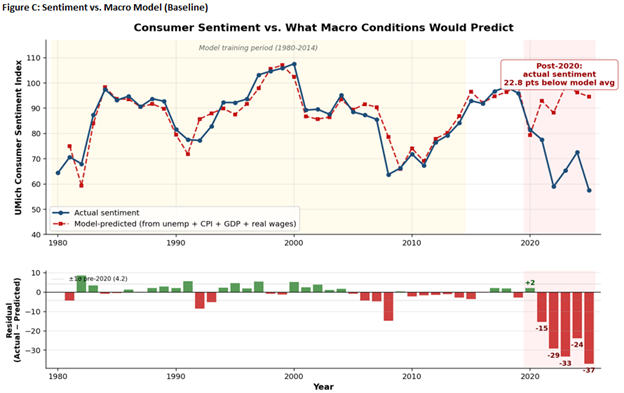
The second empirical pattern concerns consumer sentiment as measured by the University of Michigan Index of Consumer Sentiment. The analysis estimates an OLS model of annual UMich sentiment as a function of four macroeconomic variables: unemployment rate, CPI inflation, real GDP growth, and real median wage growth. Figure C plots actual sentiment against model-predicted sentiment from 1980 through 2025, with the post-2020 period shaded to highlight the divergence. Trained on data from 1980 to 2014, the model fits the historical period well with an in-sample R² of 0.854. The estimated coefficients are economically intuitive: a one-percentage-point increase in unemployment is associated with a 3.15-point decline in sentiment, a one-point increase in CPI inflation with a 0.19-point decline, a one-point increase in real GDP growth with a 3.65-point increase, and a one-point increase in real wage growth with a 2.69-point increase.
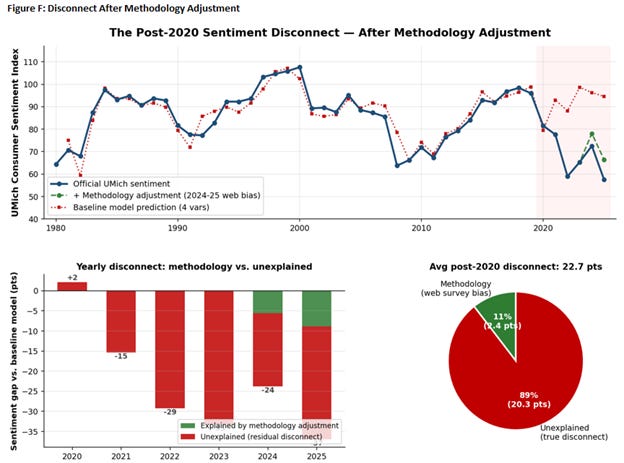
Applied to the post-2014 out-of-sample period, the model performs well through 2019. The mean residual across 2015-2019 is -0.59 points, which is well within the historical range of model error. The model also fits 2020 reasonably as the sharp economic disruption of the pandemic year produced a residual of just +2.1 points, meaning the model accurately anticipated the sentiment decline associated with the COVID shock. The disconnect opened sharply in 2021 and didn’t close. As the labor market recovered and inflation surged, the model’s predicted sentiment rose substantially to 93.0 in 2021, 88.2 in 2022, and 98.6 in 2023, while actual sentiment remained severely depressed. The residual reached -15.3 points in 2021, -29.2 in 2022, and -33.3 in 2023, the largest single-year deviation in the out-of-sample record. As inflation moderated in 2024, predicted sentiment remained elevated while actual sentiment recovered only partially, leaving a residual of -18.2 points. Through 2025, with economic fundamentals still broadly favorable by historical standards, the gap has persisted at -28.1 points.
The average post-2020 residual of -22.7 points is approximately five times the historical standard deviation of model errors. This represents an unusually large structural break, and it has persisted across different inflation regimes, two presidential administrations, and multiple years of labor market normalization.
3.3 The Social Connectedness Gradient
A third pattern emerges within the GSS itself. Figure D presents happiness changes across 2016-2018 versus 2022-2024 by respondents’ reported frequency of socializing, first with friends (the GSS variable socfrend), then with neighbors (socommun). In both cases, the pattern is the same: respondents who maintained frequent social contact experienced substantially smaller happiness declines than those who socialized infrequently.
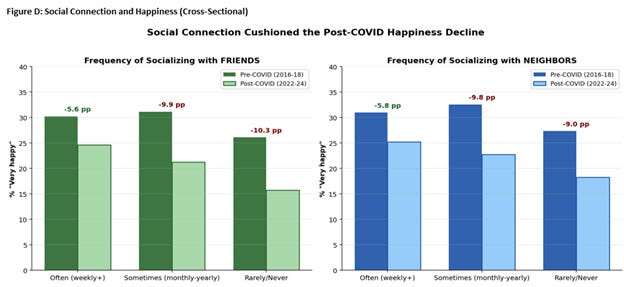
Among respondents who socialized with friends often (weekly or more), the share reporting “very happy” fell 5.6 percentage points. Among those who socialized sometimes (monthly to yearly), the decline was 9.9 points. Among those who rarely or never socialized with friends, the decline was 10.3 points, nearly double the decline of the high-contact group. The neighbor-based measure replicates the pattern: frequent socializers with neighbors fell 5.8 points, occasional socializers fell 9.8 points, and rare or never socializers fell 9.0 points.
The gradient is present across both independent measures of social contact, which strengthens the inference that it reflects something real about the role of interpersonal contact in moderating the decline of happiness. The limitation of this evidence is worth stating explicitly. This is a cross-sectional comparison in which respondents who maintained social contact almost certainly differ from those who didn’t on dimensions beyond contact itself. More extroverted individuals, those in jobs requiring in-person presence, those with larger or more stable social networks, and those in denser communities are all more likely to have maintained contact and may also be more resilient to wellbeing shocks for reasons unrelated to contact.
3.4 Population-Level Decline in Social Interaction
To address this concern, the analysis also examines changes at the population level. If the social contact gradient were driven entirely by pre-existing differences between more and less social individuals, the policy implication would be limited, as those who were already socially connected would have been insulated regardless of any broader social disruption. However if the U.S. population as a whole shifted toward less social contact post-COVID, then the mechanism indicates a story about a broad population-level change that exposed more Americans to the low-contact condition. Figure E shows that such a shift occurred. The share of Americans who report never seeing friends socially rose from 8.5% to 12.7% between the pre-COVID and post-COVID periods, the share socializing with friends several times a month fell 2.1 percentage points, and the share socializing once a month fell 3.9 points. Across all frequency categories, the distribution shifted rightward toward less contact. The mean socializing frequency score (on a 1-7 scale from never to almost daily) fell from 4.01 to 3.78.
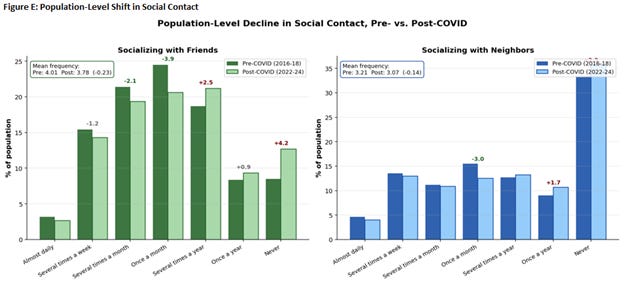
Though the shifts are smaller in magnitude, the pattern is supported by the neighbor socializing measure with the share never socializing with neighbors rising 2.3 percentage points and mean frequency falling from 3.21 to 3.07. This population-level shift addresses the selection concern only partially. It establishes that the “treatment” of reduced social contact was applied broadly across the U.S. population and makes it less likely that the cross-sectional gradient in Section 3.3 is purely a story reflecting a self-selecting group. This still doesn’t establish causation, but it does show that reduced social contact became broadly distributed across the population after COVID.
4. Empirical Strategy
4.1 Baseline Macro Model
The primary empirical tool is an OLS regression of annual UMich sentiment on four macroeconomic variables: unemployment, CPI inflation, real GDP growth, and real median wage growth. The model is estimated using data from 1980 to 2014 and then evaluated out-of-sample on the post-2014 period. This allows the post-2020 residuals to be interpreted as deviations from the historical relationship between sentiment and macroeconomic fundamentals.
The four predictors are commonly used in models of consumer sentiment and map directly onto the components of the UMich survey, which asks respondents about current and expected conditions for personal finances, business, and buying conditions. Unemployment captures labor market slack and job security concerns. CPI inflation captures purchasing power erosion. Real GDP growth proxies for the broader trajectory of economic activity. Real median wage growth captures whether the gains from economic expansion are reaching typical households rather than accruing disproportionately at the top of the distribution.
Estimated on the 1980-2014 training sample (n = 34), the model produces an in-sample R² of 0.854, indicating that the four macroeconomic variables account for approximately 85% of the annual variation in consumer sentiment over the historical period. The estimated coefficients are economically intuitive: a one-percentage-point increase in the unemployment rate is associated with a 3.15-point decline in sentiment; a one-point increase in CPI inflation with a 0.19-point decline; a one-point increase in real GDP growth with a 3.65-point increase; and a one-point increase in real median wage growth with a 2.69-point increase. The intercept of 96.78 implies a baseline sentiment level consistent with the historical average under neutral macroeconomic conditions.
The estimated model is applied out-of-sample to generate predicted sentiment for each year from 2015 through 2025. The gap between predicted and actual sentiment in each year constitutes the residual series that is the paper’s central object of analysis. A positive residual indicates that sentiment exceeded what macroeconomic fundamentals would have predicted, while a negative residual indicates that sentiment fell short.
4.2 Robustness to Alternative Explanations
Five alternative explanations for the post-2020 sentiment gap are tested, evaluating each by asking whether incorporating it into the model meaningfully reduces the out-of-sample residual.
Survey methodology adjustment. In 2024, the UMich Surveys of Consumers transitioned from telephone to web-based administration. This change is documented to have independently depressed reported sentiment by approximately 5-6 index points relative to the telephone methodology (Cummings and Tedeschi, 2024). A methodology-adjusted sentiment series is constructed by adding back an estimated 5.5-point correction to the 2024 and 2025 official readings, proportional to the web share of the sample in each year as it was phased in. The adjusted series reduces the raw post-2020 mean residual from -22.75 points to -20.35 points, an improvement representing 11% of the raw gap. The methodology change is real and the estimates account for it, but it explains a small fraction of the total disconnect. Figure F presents the year-by-year decomposition of the post-2020 gap, showing the share attributable to the web survey transition alongside the residual that remains unexplained after the adjustment.
Housing affordability. The baseline model is augmented with the NAR Housing Affordability Index (National Association of Realtors, 2024), which captures the relationship between median home prices, mortgage rates, and median household income. Housing affordability deteriorated substantially after 2020 due to a combination of pandemic-era price appreciation and the sharp rise in mortgage rates following Federal Reserve tightening in 2022. Adding the affordability index to the model improves in-sample fit marginally (R² rises from 0.854 to 0.869) but reduces the post-2020 mean residual only from -22.75 to -21.72. Housing affordability conditions are captured imperfectly by the four baseline variables, but their independent contribution to closing the sentiment gap is small.
Inequality. Income and wealth Gini coefficients were also tested as additional predictors using data from the U.S. Census Bureau’s Historical Income Tables, the World Inequality Database, and the Federal Reserve Distributional Financial Accounts. The motivation was the possibility that rising inequality may weigh on sentiment beyond what median wage growth captures. Individually, both measures appear to improve model fit, raising the in-sample R² from 0.854 in the baseline model to 0.880 with the income Gini and 0.895 with the wealth Gini, while also reducing the post-2020 residual. However, the effect weakens substantially when both Gini measures and housing affordability are included together, suggesting the apparent improvement largely reflects overlapping time trends rather than genuine explanatory power. Both Gini coefficients rise steadily throughout the sample period and closely track the post-2020 trend, making it difficult to separate inequality itself from broader changes unfolding over time. For this reason, inequality measures aren’t included in the preferred specification.
Cumulative price-level effects. An alternative to year-over-year inflation is the cumulative rise in prices since a reference year. This approach is motivated by research suggesting consumers evaluate purchasing power relative to a prior anchor rather than relative to prices a year earlier. A cumulative CPI index benchmarked to 2019 was therefore tested alongside and in place of the standard inflation measure. The cumulative price level appears to help explain the post-2020 sentiment gap and remains the most plausible conventional economic explanation. However, cumulative CPI is so closely tied to the broader post-2020 break in the data that the analysis can’t cleanly separate the two explanations. The data therefore can’t determine whether weak sentiment reflects cumulative inflation specifically or a broader divergence between sentiment and macroeconomic fundamentals after 2020. For this reason, cumulative price levels aren’t included in the preferred specification.
Partisan polarization. Partisan polarization is evaluated using party-stratified happiness data from the GSS and party-stratified sentiment data from the UMich monthly surveys. As discussed in Section 5.4, polarization can’t account for the persistent post-COVID gap because sentiment remains below pre-COVID baselines across all three partisan groups and hasn’t recovered following the January 2025 change of administration. Partisanship is therefore treated as a qualitative constraint on the interpretation of the residual rather than incorporated directly into the annual macro model.
4.3 Identification and Limitations
The macro analysis in this paper establishes that a large, persistent gap exists between actual consumer sentiment and the level predicted by standard macroeconomic fundamentals, and that this gap isn’t meaningfully closed by the most plausible conventional adjustments. What it can’t do is identify the cause of that gap as an OLS model trained on historical data can only document a structural break. The macro analysis is best understood as establishing the magnitude of what needs to be explained rather than identifying a mechanism.
The GSS evidence provides cross-sectional and population-level patterns that constrain the space of plausible explanations. The inverted status gradient rules out material hardship as the primary driver, because material hardship predicts the opposite gradient. The social contact gradient is consistent with a connectedness mechanism, and the population-level shift in socializing frequency establishes that reduced social contact was broadly distributed rather than confined to a pre-existing subgroup. Taken together, these patterns point toward a non-economic interpretation of the residual.
However, they don’t provide clean causal identification, and there are three limitations worth stating explicitly. First, the cross-sectional social contact gradient in the GSS is subject to omitted variable concerns because respondents who maintained frequent social contact after COVID may differ systematically from those who didn’t in personality, occupation, residential setting, network structure, and other characteristics correlated with both socializing and wellbeing. Second, the population level decline in socializing alongside declining happiness is correlational and could reflect a shared response to broader forces such as anxiety, changing preferences, or economic uncertainty rather than a direct causal relationship. Third, while the inverted status gradient helps rule out purely material explanations, it remains consistent with multiple nonmaterial mechanisms. The analysis speaks most directly to the social connectedness channel because the GSS includes direct measures of social interaction.
5. Results
5.1 The Inverted Status Gradient in the Happiness Collapse
The GSS analysis finds that the post-COVID happiness collapse is concentrated in groups with the strongest economic standing and is largely absent among those with the weakest. This aggregate decline is historically unprecedented. Specifically, the share of Americans reporting they are “very happy” fell from a 30.7% pre-COVID average (2016-2018) to 21.5% post-COVID (2022-2024), representing a 9.2 percentage point drop. To put this in context, the largest comparable decline in the fifty-year GSS record was only about 4-5 percentage points. While most prior recessions or social disruptions left only modest traces in aggregate happiness, this post-COVID decline is roughly twice the magnitude of any previous episode.
The pattern is consistent across four independent measures that include self-identified class, household income, educational attainment, and self-reported health. High-status groups fell dramatically, while low-status groups fell modestly or not at all. Among self-identified upper-class respondents, the very happy share fell 14.4 percentage points. Among lower-class respondents, it fell 3.6 points, a decline whose confidence interval includes zero, meaning the data are consistent with no change at all among the lowest-status group. Bachelor’s degree holders fell 14.9 points; those with associate degrees fell 3.6 points. Top earners fell 11.8 points; bottom earners fell 3.5 points. Respondents in excellent health fell 12.9 points; those in poor health fell 6.0 points.
The pairwise differentials between high-status and low-status declines are statistically significant in three of four comparisons. The bachelor’s versus high school differential (-7.8 points) and the top versus bottom income differential (-8.3 points) are precisely estimated with confidence intervals that comfortably exclude zero. The upper-class versus lower-class differential (-10.8 points) is significant at the 5% threshold despite the upper-class cell’s relatively small sample size. The health differential, while consistent in direction, is estimated less precisely given the gradient across four health categories rather than two endpoint groups.
This cross-group pattern is more than just a descriptive finding because it helps narrow down which explanations are plausible. Any explanation for the happiness collapse has to account not only for the overall decline but also for who was affected most. Standard material explanations such as inflation, housing affordability, wage stagnation, or labor market insecurity would normally predict larger declines among lower status groups, since they are more financially vulnerable and less insulated from economic stress. Instead, the data show the opposite pattern across all four status measures. This doesn’t mean material conditions played no role, but it does suggest they were unlikely to be the primary driver of the decline.
5.2 The Macro Puzzle and Its Magnitude
When tested on data outside the estimation period, the baseline macro model fits consumer sentiment well through 2019 but breaks down sharply afterward. Between 2015 and 2019, the average prediction error was just -0.59 points, comfortably within the model’s normal range and consistent with no major structural break during the rise in partisan polarization. The model also successfully captured the initial pandemic shock with a 2020 residual of +2.1 points, meaning it largely anticipated the sharp decline in sentiment that accompanied COVID. The disconnect began to surface in 2021 and deepened sharply through 2023. As the labor market recovered rapidly from the pandemic shock, the model’s predicted sentiment rose to 93.0 in 2021, 88.2 in 2022, and 98.6 in 2023, levels consistent with a historically strong labor market and moderating but still-elevated inflation. Actual sentiment moved in the opposite direction during this period, falling to 77.6 in 2021 and reaching a post-war low of 59.0 in 2022. The resulting residuals are -15.3 points in 2021, -29.2 in 2022, and -33.3 in 2023, the largest sustained out-of-sample deviations in the model’s history.
As inflation moderated through 2023 and 2024, predicted sentiment remained elevated while actual sentiment recovered only partially. The methodology-adjusted residual for 2024 is -18.2 points. Through 2025, despite an unemployment rate and wage growth trajectory that would historically have predicted sentiment well above 90, actual sentiment has remained severely depressed with a residual of -28.1 points on the adjusted series. The post-2020 mean residual of -22.7 points (raw) and -20.4 points (methodology-adjusted) is approximately five times the historical standard deviation of model errors. This isn’t a marginal anomaly that additional refinement might resolve. The historical model error standard deviation of roughly 4 points reflects the normal range of variation attributable to omitted variables, measurement error, and model misspecification. A residual five times that size, sustained over five consecutive years and across multiple macroeconomic regimes, constitutes a structural break. It suggests that after 2020, consumer sentiment began being shaped by something that either wasn’t present before or hadn’t mattered nearly as much during the previous four decades covered by the model.
The absence of a comparable break around 2015-2016 is worth emphasizing. That period saw a significant increase in partisan polarization in both political behavior and consumer sentiment responses, and it’s sometimes cited as the beginning of the sentiment-fundamentals divergence. The out-of-sample residuals tell a different story as the 2015-2019 period’s mean residual of -0.59 points is indistinguishable from the normal range of model error. Whatever structural shift produced the post-2020 gap didn’t begin in 2016, which constrains partisan polarization as an explanation for its origin.
5.3 Evidence Consistent with a Social Connectedness Channel
Three patterns in the GSS data are consistent with the idea that declining social connectedness contributed to the post-COVID happiness collapse. Together, the patterns point in a consistent direction.
The cross-sectional contact gradient. Figure D shows happiness changes by reported socializing frequency for both friends and neighbors. Among respondents who socialized with friends often, defined as weekly or more, the share reporting they were “very happy” fell 5.6 percentage points between the pre and post COVID periods. Among those who socialized only sometimes, the decline was 9.9 points, while among those who rarely or never socialized with friends, the decline reached 10.3 points. The neighbor measure shows a similar pattern. Frequent socializers experienced a 5.8 point decline, occasional socializers fell 9.8 points, and rare or never socializers fell 9.0 points.
The consistency of the pattern across both measures strengthens the case that interpersonal contact matters for wellbeing. Respondents with high levels of social contact experienced only about half the happiness decline seen among low contact respondents. At the same time, the analysis can’t establish causation because people who maintained strong social ties after COVID may differ from others in ways that also protect wellbeing. They may be more extroverted, more residentially stable, more likely to work in person, or more embedded in durable social networks.
The population-level shift in social contact. Figure E helps address the selection concern by showing that the U.S. as a whole became less socially connected after COVID. The share of Americans who reported never seeing friends socially rose from 8.5 percent to 12.7 percent. At the same time, the share socializing several times a month fell 2.1 percentage points and the share socializing once a month fell 3.9 points. Average socializing frequency on a 1 to 7 scale declined from 4.01 to 3.78. The neighbor measure shows a similar yet smaller pattern with never contact rising 2.3 percentage points and average frequency falling from 3.21 to 3.07. This broader population shift matters for two reasons. First, it suggests that reduced social contact wasn’t limited to a small group of already isolated individuals but became more widespread after the pandemic. Second, even if the cross-sectional contact gradient partly reflects pre-existing differences between more and less social people, a population wide shift toward lower social contact would still imply a population wide shift toward lower wellbeing through the same channel. In that sense, the cross-sectional gradient and the population level shift reinforce each other rather than simply repeating the same evidence.
The inverted status gradient as corroborating evidence. The finding in Section 5.1 that high-status groups experienced the largest happiness declines is also consistent with a social connectedness interpretation. Remote work, which eliminated a major source of daily in-person interaction, was concentrated disproportionately among college-educated, higher-income knowledge workers (Dingel & Neiman, 2020). The professional and community organizations through which upper-middle-class Americans typically maintain social ties were among the most severely disrupted by the pandemic and had not fully reconstituted by the mid-2020s (Jones & Cox, 2023; AmeriCorps & U.S. Census Bureau, 2024). If higher status groups depend more heavily on these forms of social connection, then a broad disruption to social life would be expected to produce larger declines in happiness among those groups.
5.4 Distinguishing from Partisan Polarization
A natural alternative explanation for the post-2020 sentiment gap is partisan polarization. It’s well-documented that consumers affiliated with the party in the White House report substantially higher sentiment than those whose party is out of power, and that this partisan gap has widened significantly since 2016 (Hsu, 2024; O’Trakoun, 2024). One might argue that the residual in the macro model reflects not a genuine decline in wellbeing but rather an artifact of increased expressive responding by out-party consumers under the Biden administration.
This paper finds this explanation insufficient on three grounds. First, the partisan gap in happiness in the GSS is inconsistent with the shape that expressive responding would predict. Under a partisan story, the expectation would be for the happiness collapse to be concentrated among Republican respondents as the out-party during 2021-2024, with Democrats relatively insulated. Instead, the weighted decline in the share reporting “very happy” is broadly symmetric: Democrats fell 10.8 percentage points, Republicans 9.5 points, and Independents 7.8 points. Republicans fell nearly as hard as Democrats under a Democratic administration, which is the opposite of what pure expressive responding predicts.
Second, the social contact gradient holds within each partisan group and is actually steepest among Republicans. Among Democratic respondents, those with high social contact experienced a happiness decline of 8.9 percentage points compared to 11.9 points among those with low contact. Among Independents the gradient is 4.4 points (-4.1 vs. -8.5). Among Republicans it’s 9.3 points (-1.7 vs. -11.0). This within-group pattern is difficult to reconcile with a partisan expressive account. If Republican pessimism were primarily an expressive act directed at the Biden administration, there’s no obvious mechanism by which it would manifest so much more strongly among socially isolated Republicans than among well-connected ones. Social contact appears to be doing independent work within partisan groups, not merely proxying for them.
Third, the UMich party-stratified data allow a direct reversal test. If the post-2020 fundamentals gap were primarily a partisan artifact, the expectation would be for it to close, particularly for Republicans, following the January 2025 change of administration. It hasn’t. Republicans averaged 120.2 on the UMich index during 2017-2019 and 91.8 during 2025-2026, a deficit of 28.4 points despite their party holding the presidency. Independents, whom the UMich team itself identifies as the least expressively motivated group and the recommended benchmark for reading aggregate sentiment (Hsu, 2024), haven’t recovered at all: their average of 96.6 pre-COVID has fallen to 65.6 during the Biden era and further to 53.8 under the current administration, the lowest reading in the dataset. The gap from pre-COVID fundamentals has widened, not closed, across the administration change.
This paper doesn’t claim that partisan dynamics play no role in the post-2020 sentiment picture. The level differences between partisan groups at any given moment are real, well-documented, and almost certainly reflect some degree of expressive responding. The sharp Democratic decline following the January 2025 inauguration is a case in point. The claim is narrower: partisan expressive responding accounts for the shape of the post-2020 sentiment distribution, who is relatively more or less pessimistic at a given moment, but it can’t account for the location of that distribution relative to pre-COVID baselines. The below-baseline gap persists across all three partisan groups, is largest among the group with the least expressive motive, and hasn’t closed with a change of administration. Partisanship is part of the landscape of post-2020 sentiment, but it isn’t a sufficient explanation for the fundamentals gap this paper documents.
5.5 Ranking the Conventional Explanations
After testing the major conventional explanations, the picture becomes clearer. The 2024 University of Michigan survey methodology change is real but modest, accounting for only about 2.4 points of the roughly 22.7 point post COVID sentiment gap. Housing affordability also deteriorated sharply after 2020, but incorporating the NAR Housing Affordability Index reduces the residual by only about 1 point, suggesting housing conditions explain little of the remaining divergence.
Income and wealth inequality initially appear to improve model fit, but the effect is likely misleading because the Gini coefficients trend steadily upward throughout the sample and closely track the post 2020 time trend. Cumulative inflation since 2019 remains the most plausible conventional economic explanation. Research on loss aversion suggests consumers may evaluate purchasing power relative to a pre pandemic price baseline rather than year over year inflation rates (Tversky & Kahneman, 1991). However, cumulative CPI is so closely tied to the broader post 2020 break in the data that the analysis can’t cleanly distinguish between the two explanations.
Partisan polarization helps explain differences between political groups but not the broader collapse in sentiment since all partisan groups remain below their own pre COVID baselines. Taken together, the conventional explanations either account for only a small share of the gap or can’t be cleanly identified in the data. A large and persistent residual remains, and the evidence from Sections 5.1 through 5.3 points toward a broader deterioration in subjective wellbeing with declining social connectedness emerging as the clearest measurable candidate.
6. Discussion
The findings in this paper suggest that post-COVID consumer sentiment has been shaped less by traditional economic conditions than by broader social forces outside standard macroeconomic models. This section develops that interpretation, distinguishes stronger from more tentative conclusions, and considers what this implies for reading sentiment data going forward.
6.1 Two Claims of Different Strength
It is useful to separate two claims that the evidence supports to different degrees. The first and stronger claim is that standard material explanations are insufficient to explain the post 2020 collapse in consumer sentiment and happiness. Multiple pieces of evidence point in the same direction. The macro model residual is extraordinarily large by historical standards and has persisted for five consecutive years across different inflation environments and two presidential administrations. At the same time, the GSS data show an inverted status gradient in which higher status groups experienced some of the largest happiness declines, the opposite of what would be expected if worsening material conditions were the primary driver. This argument doesn’t require identifying the exact cause of the decline. It only requires showing that the factors which normally explain sentiment no longer fully do, and the evidence strongly supports that conclusion.
The second and weaker claim is that declining social connectedness contributed to the decline. Several patterns in the GSS are consistent with this interpretation, including the cross-sectional relationship between social contact and happiness, the broader population level decline in socializing after COVID, and the concentration of large happiness losses among groups whose social infrastructure was heavily disrupted by remote work and institutional breakdown. Together, these patterns fit naturally with a connectedness explanation, but they stop short of establishing causation. The cross-sectional evidence raises selection concerns, the population level shift is correlational, and the inverted status gradient could also reflect other non-material mechanisms. The argument is therefore not that social connectedness is the single definitive explanation, but that it emerges as a plausible and measurable contributor. Of the two claims, the negative finding is the stronger contribution. It stands on its own regardless of whether the social connectedness interpretation ultimately proves correct, and it’s the one the evidence supports most directly.
6.2 Alternative Non-Material Mechanisms
The social connectedness channel is the mechanism most directly supported by the data, but it isn’t the only non-material mechanism consistent with the patterns documented here. Three alternatives deserve acknowledgment.
Reference-group effects offer one possible explanation. Higher-status individuals may have experienced larger declines because they entered the post-COVID period expecting stability, predictability, and control, making prolonged disruption psychologically more costly for them than for people more accustomed to instability. Another possibility is the shift toward screen-based interaction. Remote work was concentrated among higher-income workers, and if online environments are systematically more negative than direct social interaction, then increased exposure to digital spaces may have amplified pessimism independently of reduced social contact itself. A third possibility is a broader erosion in perceived social stability, meaning a growing sense that institutions are weakening and the social fabric is fraying. Higher-status individuals who depend more heavily on stable institutions may have felt this especially strongly.
6.3 Implications for Sentiment Measurement and Macroeconomic Forecasting
If consumer sentiment is partly socially embedded, then large and persistent deviations from macroeconomic predictions shouldn’t automatically be treated as evidence of economic mismeasurement. The conventional response is to search for omitted economic variables, and that search remains worthwhile, but five years of investigation have failed to close the post-COVID gap. The cross-group pattern of the happiness collapse points away from standard material explanations rather than toward better economic ones. This has implications for how sentiment data should be interpreted. A sentiment index that partly captures social wellbeing and generalized social confidence may become a weaker predictor of spending behavior during periods of major social disruption, when the historical relationship between economic fundamentals and sentiment breaks down.
7. Conclusion
The post-2020 consumer sentiment puzzle isn’t resolvable by better measurement of economic conditions. The macro residual is too large, too persistent, and too inconsistent with every conventional adjustment tested to be an economic mismeasurement story. The GSS happiness data reinforce this: a collapse concentrated among economic winners, largely absent among economic losers, and stable in its inverted shape through 2024 simply doesn’t fit any mechanism rooted in material hardship. The patterns documented here, including the cross-sectional contact gradient, the population-level shift toward less social interaction, and the persistence of the inverted status gradient across methodologically comparable waves, are consistent with a deterioration in social wellbeing of which declining social connectedness is one plausible component. The stronger claim, and the one the evidence supports most directly, is the negative one: something beyond economics is driving the gap.
The broader implication is that consumer sentiment indices may be substantially less purely economic than standard macro models assume, particularly following large-scale social disruptions that weaken the historical relationship between economic fundamentals and generalized social wellbeing. Policymakers who expected recovering fundamentals to restore public confidence were always going to be partially disappointed if a meaningful share of the gap reflects social conditions that economic policy doesn’t directly reach. Taking seriously the long-run decline in American social connectedness that the post-COVID period appears to have intensified isn’t just an academic exercise. It’s relevant to understanding one of the more persistent and consequential disconnects between how the economy looks and how Americans say it feels.